Every business should have a goal management system in place in order to track its progress and ensure it is on the right path to success. Many would agree that one of the most important components of this system is a company’s key performance indicators (KPIs).
In this article, we will provide a comprehensive guide to KPIs and explain how you can use them to achieve your business goals. We’ll also discuss how combining KPIs with a framework like Objectives and Key Results to elevate the work environment and inspire your workers to drive change.

What are KPIs?
KPI stands for key performance indicator and it is a quantifiable measurement used to gauge the performance of an objective over a set period of time. KPIs are used in business to track progress or milestones and provide further insights on whether or not objectives are being met.
There are two main types of KPIs: leading and lagging. Leading indicators are used to predict future performance, while lagging indicators show past performance.
KPIs involve specific numerical targets and can be set for any time range but the most common are: weekly, monthly, quarterly, or yearly. They can be set on all levels in an organization: company, department, team, and in some cases for individuals.
Benefits of using KPIs
A business uses key performance indictors as tangible metrics showing past performance and measuring it against current performance. These indicators are the building blocks that allow your company to move toward the future.
Even more, KPIs help businesses hold employees accountable for meeting goals and driving change. Data is factual information that holds no bias. There is no room to be subjective when setting goals and looking at the numbers. Either your team meets the agreed upon target that was set, or they don’t. KPIs give you the leverage to have conversations with your team about their performance.
Finally, KPIs can provide valuable insights into customer behavior and trends over time. When used correctly, KPIs can be a powerful tool for businesses to make more informed decisions and improve their bottom line.
🎯See the benefits of using KPIs in Weekdone. Set your targets alongside OKRs and shoot for the moon!
Defining characteristics of KPIs
Before gathering teams together and brainstorming what KPIs would be best to track, it is important to understand the characteristics that make up a good KPI.
Defining performance indicators with the following characteristics ensures you’re choosing values that have impact on your business versus something that misses the mark.

Simple
A good KPI is simple. This means that it should be easy to understand and measure. The goal is to avoid anything that is overly complicated or difficult to calculate.
You want your team to be able to look at the KPI and immediately understand its purpose. With too much data behind it, or if the metric is too complicated, it will be difficult to draw any insights from it.
Meaningful
All of your KPIs should be meaningful and relevant to your business. This means that they should be aligned with your company’s goals and objectives. As you’ll learn later in this article, partnering your KPIs with a strategic goal-setting methodology can create a powerful organizational system that drives you business forward.
If a KPI does not help you track progress towards your goals, then it is not worth tracking.
For example, if one of your company’s objectives is to increase sales, then your key performance indicator should certainly be related to: revenue, customer lifetime value, churn rate, or even reducing the length of the sales cycle.
Quantifiable
As the name suggests, a key performance indicator help you measure the performance of a team or company as a whole. A KPI target is a number that individuals within an organization use as an anchor for their goals.
Tracking KPIs gives a full overview of company performance over time. KPIs should be written as 1 target value – a “strive score” so to speak. Save the comparison and improvement values for Key Results.
Time-sensitive
By including a time-frame in all of your KPIs you’ll ensure that your team has a sense of urgency and knows the expectations of the goals that have been outlined. The time frame depends entirely on the needs of your business and the actions you take to achieve your goals.
Increasing your organic traffic is going to take time so your range can be anywhere from 6 months to a year. On the other hand, reducing response time for website chats could be evaluated on a weekly basis.
Setting KPIs in your business
Now that you understand the benefits of KPIs in business and the key qualities they need to have, you can get started crafting your own.
Below are some guidelines based on expertise that should help you streamline the process.

Determine the biggest area of need
You won’t know which KPIs you need to track until you take a step back and analyze your business. Determine which areas of your company need the most attention and focus on setting KPIs for those specific departments or goals.
For example, if you’re trying to increase leads from your website, then you’ll want to set KPIs that focus on traffic, conversion rates, and lead quality. Determining where in your business KPIs can make the most difference will help save you time and resources down the line.
Pull out specific numerical targets
By singling out the areas where your business needs most attention, you’ll see what data you need to track to make impact on your overall goals. In the lead generation example above, we can pull out specific KPIs like webinar signups or attendance rates.
KPIs should always be specific and measurable so that you can accurately track progress. This helps you determine if a goal is being met and, if not, where you need to make changes.
Define your business objectives
Now that you have KPIs set in place, you can create strategic goals that help you define the path toward that target.
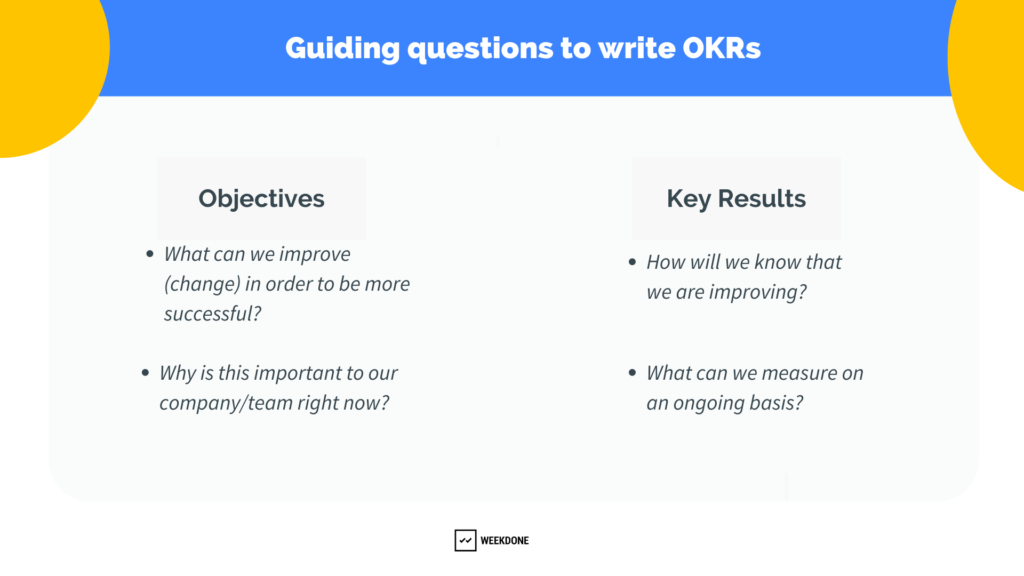
The Objectives and Key Results methodology helps you do this. OKRs are the action for improvements and change. They can help outline the “how” for meeting various KPI targets.
Objectives are the qualitative component that reminds you and your team of what needs to change. Key Results are the quantitative factor that measures the outcomes.
Below is an example you can use to get started:
Area of need: lack of leads
Marketing KPI: 700 “qualified leads”
This KPI highlights a target value for the quarter (or tracked time period) as is specific to your company’s definition of “qualified leads”
Objective: Increase our qualified and engaged leads count for the quarter
Key Result 1: Increase leads from webinars from 5 to 15 per week
Key Result 2: Increase sign-ups to learning materials from 300 to 900 this quarter
Key Result 3: Gain 300 new e-mail addresses from X campaign
This OKR is specific to the KPI and area of need. By writing a qualitative objective with measurable key results, teams are more focused on what will make a difference.
Furthering the OKR process, individuals will set initiatives that help drive Key Results forward – like creating a new campaign, facilitating and promoting 3 webinars, optimizing 15 existing learning materials.
Ensure they match the characteristics
Once you’ve gathered a list of KPIs you want to focus on, make sure they match the characteristics discussed earlier. This includes making sure they’re quantifiable, specific, measurable, and time-sensitive.
If a KPI doesn’t meet all of these criteria, it’s likely not going to be helpful in achieving your goal. Either your team will be confused by the data or they won’t be able to tie it in to your overall goals.
Define all aspects of KPIs
Before you start implementing your KPI and taking action, define all aspects of the KPI so your team can be clear on pertinent details.
The examples here provide more context on your KPIs:
- Description – Write a consider description of the KPI being measured and the insights you want it to reveal.
- Formula – If there is any calculation required to achieve the final KPI metric, include it so your team knows how to reach the desired number.
- Reporting frequency – How often do you want to reevaluate the KPI? Include this information to ensure progress is being made.
- Owner – Define the specific team of individuals that will be in charge of the KPI and its overall performance.
- Target – State the end goal measurement you are trying to achieve.
Align with your team
Have one final meeting with your team over the KPI targets, objectives, and how you’ll measure and track the metrics. Host this meeting a day or two after your team has come up with the KPIs. You want to give them time to mull it over to see if any additional insights have come to light.
You should also create a system for tracking progress so that you can quickly identify any areas of improvement. Doing this will help you make changes to your strategy in real-time so you can better achieve your goals.
Tracking and measuring KPIs
Tracking your KPIs is essential to utilize all the time and resources your team spent identifying them in the first place. Setting up an efficient tracking system is also necessary to prevent putting even more work on your team and distracting them from their main roles.
Here are some tips to track and measure your KPIs appropriately.

Gather data using software
You’ll want to automate data collection as much as possible to make tracking more efficient. This way, you won’t have to rely on manual data entry that can easily lead to human error and expensive labor costs.
KPI tracking software is your best bet to get clear data that is reliable and accurate. Most software for KPIs are easy to use and can quickly be integrated into your current set of tools so it won’t take days or weeks to learn and implement.
Analyze your progress
The frequency of time you defined when setting up your KPIs will determine how often you should analyze your progress. When it’s time, you’ll want to look at the data and compare it to the original data you gathered before you began making changes to the business.
Set different levels of progress that clearly let your team know how the KPI is doing. You can use a simple process like stoplight colors to highlight at a glance the progress being made.
For example:
Red 🔴 If progress is worse than before, or ‘off track’ to achieve the target by the end of the time period.
Yellow 🟡 If the progress has been minimal, or is ‘at risk’ of meeting the target
Green 🟢 When your team has met, or exceeded expectations.
Share with your team
Make sure the entire team is involved in the process of tracking and analyzing KPIs. Doing this gets everyone on the same page, understanding their roles, and taking ownership of their contributions to the business. In your team, you’ve defined individual responsibilities related to the KPI, and now it’s time for adjacent departments to give their feedback.
Share data through regular team meetings or by sending out a report via email or an internal messaging system. You should also include a section on KPIs in your company’s annual report so that shareholders and other interested parties are up-to-date on progress.
Decide future actions
After discussing the collected data and progress of company KPIs, it’s time to make decisions about the future. Most importantly, you want to be proactive – there’s nothing like waiting until it’s too late and scrambling to change course.
Your team should have a plan in place for what needs to happen if a KPI isn’t being met or if it exceeds expectations. This way, you can avoid any confusion or guesswork that could lead to more problems down the road.
KPIs are a necessary tool for any business that wants to be successful. Take the time to set and track them. By doing this, you ensure your team is always aware of, and working towards the big picture, bottom-line goals.
Good KPI examples
If your company hasn’t made KPIs a priority in the past it will be difficult to determine how to use them effectively for your business.
Here are some examples of Company level KPIs and team KPIs to get you started.
Company
– Annual sales growth hits X% per year
– Customer satisfaction reaches X%
– Customer lifetime value increases X% per quarter
Design
– Increase social media asset creation to X this quarter
– Improve revision rate by achieving X%
– Estimated time vs actual time margin decreases X%
HR
– Employee productivity rate increases X% per quarter
– Internal promotion rate reaches X%
– Turnover rate decreases X% per quarter
Marketing
– Increasing the number of qualified leads by X%
– Achieve the cost per lead to become $X
– Hit X amount of organic website traffic this quarter
Sales
– Lower lead response time to X hours
– Increase lead conversion rate to X%
– Up sell increases
Customer service
– Lower customer retention cost to $X
– Maintain X% customer satisfaction
– Gather X new testimonials by end of the quarter
KPIs with OKRs
Key performance indicators (KPIs) and Objectives and Key Results (OKRs) are two different but complementary systems for measuring business performance. While they share some similarities, they are each used for different purposes.
KPIs measure the performance of different areas of your business, whereas OKRs are for setting strategic goals and measuring progress on outcomes that align with the company objective.
When using KPIs and OKRs together, you have a streamlined goal process which creates more data-driven, results-oriented teams. Through this process, you motivate employees as they see themselves making a difference in what actually matters.
On a company level, start by gathering KPIs. You want to know what the business needs, and high-level targets help keep the eyes on the prize!
Then, establish your over-arching Company Objective. This should be an inspirational statement that teams use to break down their Team OKRs, KPIs, initiatives, and weekly plans.
Example for Sales Team:
Say your Sales team wants to increase the number of consultations received this quarter from 100 to 300. Their KPI is now: 300 consultations.
Now, define a statement of improvement or change that will help motivate your company to get there.
Objective: Encourage more new visitors to book consultations with our Sales team – engage and build relationships from day one.
Next, how can you measure the success of this objective? Aside from reaching 300 consultations, how can you achieve the goal?
- Do you need to hire new sales representatives to handle the influx of consultations?
- Is it possible to offer more incentives for customers to book a consultation?
- Does the website need to be optimized for consultations?
Use these questions to help define Key Results. Key Results help you measure outcomes, not outputs.
- X new hires complete 100% onboarding materials
- Gain customer satisfaction survey responses from X new users
- Increase sign-ups from new incentives on the website from X-Y%
Together, KPIs and OKRs create a goal management system that breaks down crucial improvement areas of focus into digestible action items.
5 tools to support KPIs in business
To make the process of using and implementing KPIs in your business, you’ll want to use the best tools available. Each one has a set of unique benefits for different kinds of businesses.
1. Weekdone
Weekdone is not an exclusive KPI software, but rather an OKR software with KPI reporting and visualization dashboards. Leaders looking to take goal efficiency to the next level – try Weekdone!
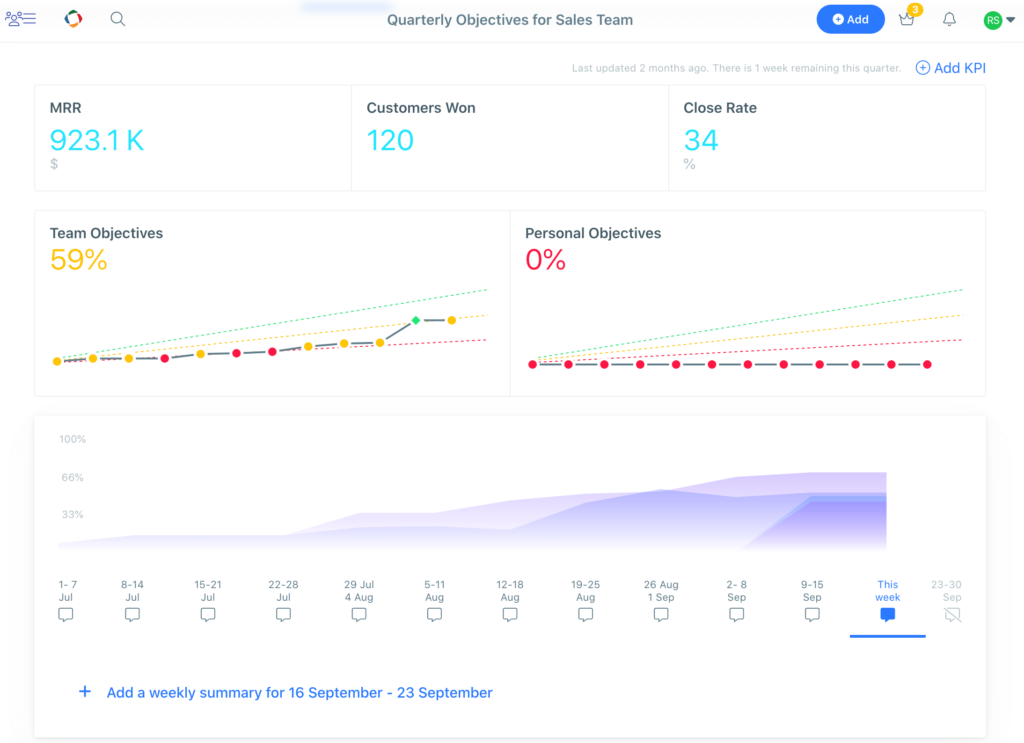
Businesses can manually add KPI data, or integrate data from Google Sheets for automatic updates. Thanks to the easy-to-read dashboards, reporting and tracking KPIs is easier than ever. Additional presentation views (and a TV dashboard) keep numbers at the forefront during weekly meetings.
And, if you’re new to the OKR methodology for goal setting, be sure to choose from the in-product OKR examples. With this feature, teams can add pre-made goals directly into their accounts and tailor to their needs.
Features:
- Google Sheets integration (and more)
- Automated Reporting
- Various data visualization views (hierarchy, tree, calendar)
- OKR example sample data
- Customize templates
- OKR coaching included for paid users
Pricing Details:
- Free plan available for 1-3 users
- Monthly per user pricing
- Annual packages at a discounted rate
See the price for your company here
2. Geckoboard
Geckoboard allows teams to create easy-to-understand dashboards and share them across the entire organization. The platform integrates with 80 different tools so it’s easy to implement with your current system without taking your team time to figure out.
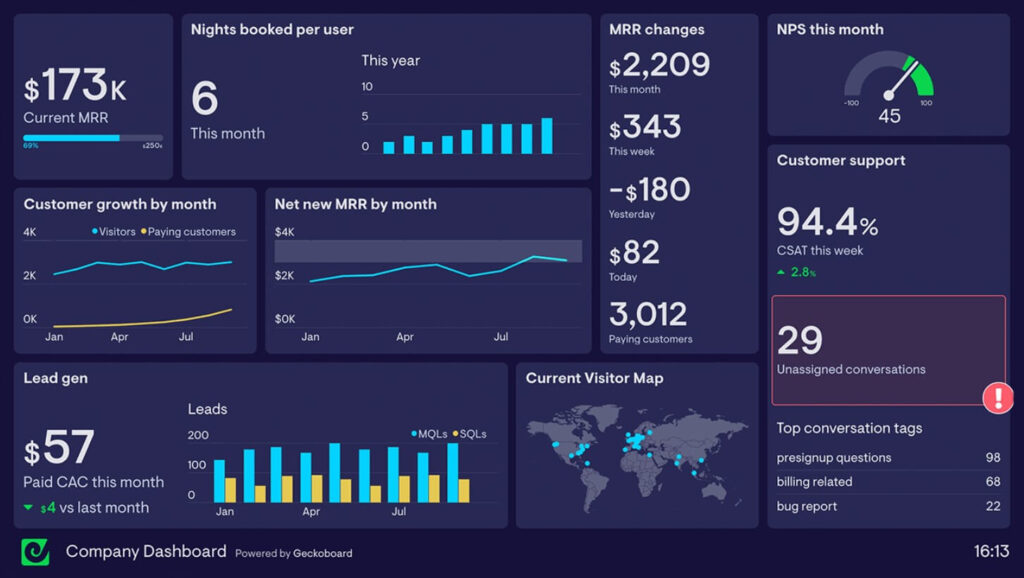
Use the simple drag-and-drop interface in order to easily include the exact metrics your looking to track. Further making the the program unique is the ability to make changes in your metrics with status indicators so your team can quickly see your KPI progress. Companies who don’t have much experience with tools might prefer Geckoboard’s easy-to-use platform.
Features:
- Drag and drop interface
- Integrates with 80 different tools
- Filters to sort through metrics
Pricing Details:
- Essential – $49/mo, 3 users
- Pro – $99/mo, 10 users
- Scale – $699’/mo, 25 users
3. Asana
Asana is well known as one of the best project management tools on the market, but it also happens to be a great way to track KPIs. Moreover, you can add and manage tasks, see the big picture of all projects, and give your team the ability to notice thorough details and broad concepts at the same time.
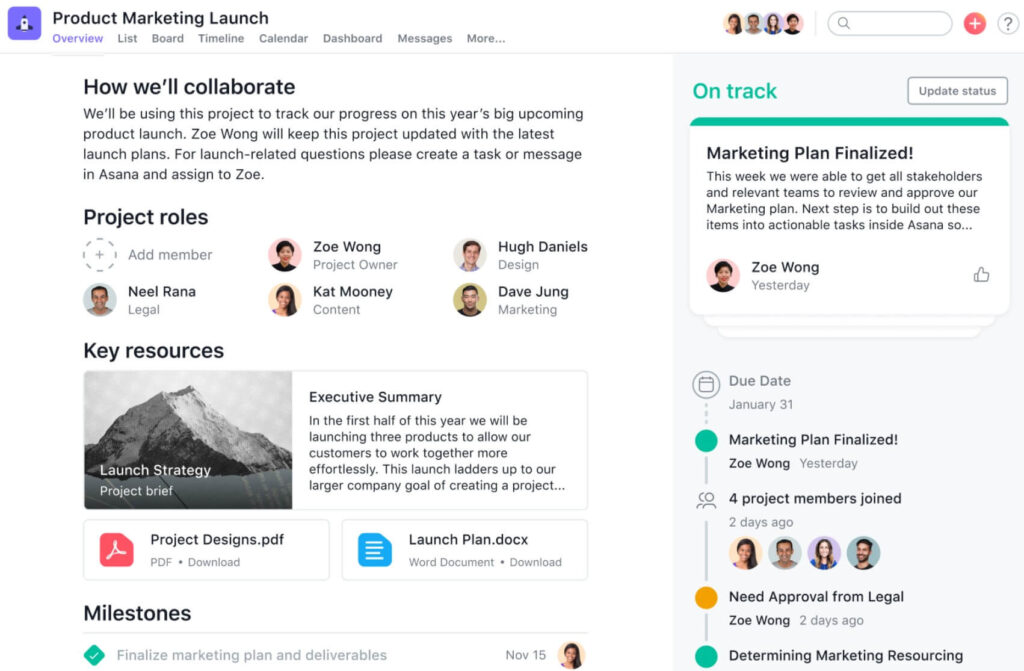
You can use Asana’s conversation feature for real-time collaboration with your team so everyone is always on the same page. The software also makes it easy to integrate with other tools you might be using in your business. Larger companies are more prone to using Asana given the complex capabilities and scalability.
Features:
- Set up cards with pertinent project information
- Ability to converse with team members across various projects
- Various KPI overviews available
Pricing Details:
- Basic – $0
- Premium – $10.99/mo
- Business – $24.99/mo
- Enterprise – Contact Sales
4. Tableau
In Tableau, you don’t have to create KPIs from scratch as the company provides pre-built templates you can choose from to save time.
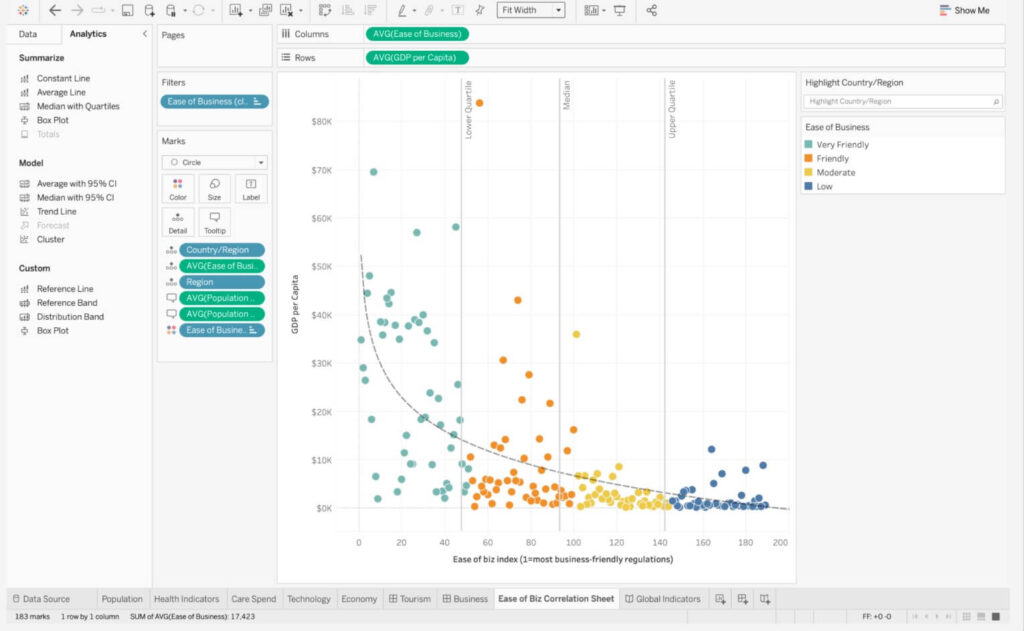
Organizations involved with retail or eCommerce will benefit the most from the platform since it includes specialized features for those industries. Blending of real-time data is unique to the platform – by sharing company input from any pre-existing databases with updates as they happen. Then, the software offers advice and actionable insight to take based off the information.
Features:
- Real-time data blending
- KPI templates to choose from
- CRM analytics
Pricing Details:
- Tableau Viewer – $15/mo
- Tableau Explorer – $42/mo
- Tableau Creator – $70/mo
5. SimpleKPI
As the name would suggest, SimpleKPI’s strong suit is making the platform easy for just about anyone to use. That makes it ideal for teams that have little to no experience with KPI tracking platforms.
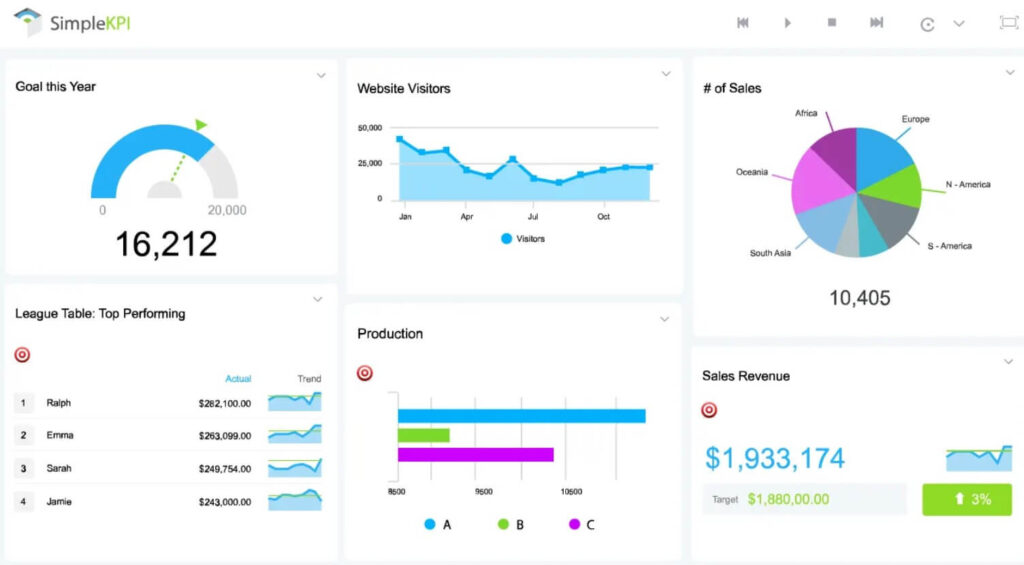
Given the simplicity, the metric tracking is impressive! Ranging from financial metrics to marketing metrics to operational metrics. Each department can benefit from the KPI tracking and your own OKR system. Almost any type of business in any industry can enjoy SimpleKPI.
Features:
- Easy-to-use dashboard
- Various KPI metric tracking
- Analysis features
Pricing Details:
- One package only for $99/mo
Grow Momentum with KPIs and OKRs
In the end, KPIs and OKRs give teams the freedom to drive improvements while keeping an eye on umbrella, high-level targets. Ultimately, all metrics align – from daily to weekly tasks to longer-term monthly and quarterly initiatives. Hold your company and teams accountable to innovate, collaborate, and achieve more!